<%NUMBERING1%>.<%NUMBERING2%>.<%NUMBERING3%> PRTG Manual: ClusterState Sensor
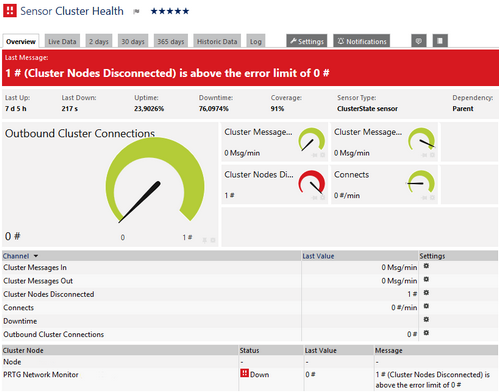
The ClusterState sensor monitors the health of a PRTG cluster and indicates PRTG's own system health status.
It measures various internal system parameters of the cluster system:
- Number of connects per minute
- Cluster in- and outgoing messages per minute
- Number of connected and disconnected cluster nodes.

ClusterState Sensor
Click here to enlarge: http://media.paessler.com/prtg-screenshots/clusterstate.png
- PRTG creates this sensor automatically with a cluster installation. You cannot delete or add it manually.
- If at least one cluster node is disconnected, this sensor shows a Down status by default.
- On the sensor's Overview tab you can review the states of each cluster node.
- On the monitoring data review tabs you can choose the cluster member of which you want to show data (or of all nodes).
On the details page of a sensor, click on the Settings tab to change its settings.
Note: Usually, a sensor connects to the IP Address or DNS Name of the parent device on which you created this sensor. See section Device Settings for details. For some sensor types, you can define the monitoring target explicitly in the sensor settings. Please see below for details about available settings.
Basic Sensor Settings |
|
|---|---|
Sensor Name |
Enter a meaningful name to identify the sensor. By default, PRTG shows this name in the device tree, and in alarms, logs, notifications, reports, maps, libraries, and tickets. |
Tags |
Enter one or more tags, separated by space or comma. You can use tags to group sensors and use tag-filtered views later on. Tags are not case sensitive. We recommend using the default value. You can add additional tags to it, if you like. Other tags are automatically inherited from objects further up in the device tree. Those are not visible here. |
Priority |
Select a priority for the sensor. This setting determines where the sensor is placed in sensor lists. Top priority is at the top of a list. You can choose from one star (low priority) to five stars (top priority). |
Sensor Display |
|
|---|---|
Primary Channel |
Select a channel from the list to define it as the primary channel. In the device tree, the last value of the primary channel will always be displayed underneath the sensor's name. The available options depend on what channels are available for this sensor. Note: You can set another primary channel later by clicking on the pin symbol of a channel in the sensor's overview tab. |
Chart Type |
Define how different channels will be shown for this sensor.
|
Stack Unit |
This setting is only available if stacked graphs are selected above. Choose a unit from the list. All channels with this unit will be stacked on top of each other. By default, you cannot exclude single channels from stacking, if they use the selected unit. However, there is an advanced procedure to do so. |
By default, all following settings are inherited from objects higher in the hierarchy and should be changed there, if necessary. Often, best practice is to change them centrally in the Root group's settings. To change a setting for this object, disable inheritance by clicking on the check mark symbol in front of the respective setting name. You will then see the options described below.
Scanning Interval |
|
Scanning Interval |
Select a scanning interval (seconds, minutes, or hours) from the list. The scanning interval determines the time the sensor waits between two scans. You can change the available intervals in the system administration. |
When a Sensor Reports an Error |
Define the number of scanning intervals a sensor has to report an error until the sensor will be set to a Down status. The sensor can try reaching a device several times, depending on your setup you can specify here, to help avoid false alarms if the monitored device has only temporary issues. For previous scanning intervals with failed requests, the sensor will show a Warning status. Choose between:
Note: Sensors that monitor via Windows Management Instrumentation (WMI) always wait at least one scanning interval until they show an error. It is not possible to set a WMI sensor "down" immediately, so the first option will not apply to these sensor types (all other options can apply). Note: If a sensor has defined error limits for channels, this sensor will always be set to a Down status immediately, so no "wait" option will apply. Note: If a channel uses lookup values, the sensor will always be set to a Down status immediately, so no "wait" options will apply. |
Access Rights |
|
User Group Access |
Define which user group(s) will have access to the object you're editing. A table with user groups and right is shown; it contains all user groups from your setup. For each user group you can choose from the following access rights:
You can create new user groups in the System Administration—User Groups settings. To automatically set all objects further down in the hierarchy to inherit this object's access rights, set a check mark for the Revert children's access rights to inherited option. For more details about access rights, please see section User Access Rights. |
To change display settings, spike filter, and limits, switch to the sensor's Overview tab and click the gear icon of a specific channel. For detailed information, please see Sensor Channels Settings section.
Click the Notifications tab to change notification triggers. For detailed information, please see Sensor Notifications Settings section.
For more general information about settings, please see Object Settings section.
For information about sensor settings, please see the following sections:
Keywords: