<%NUMBERING1%>.<%NUMBERING2%>.<%NUMBERING3%> PRTG Manual: PRTG Administration Tool on Remote Probe Systems
If you start the PRTG Administration Tools on a system on which a PRTG Remote Probe runs, you can define various probe related settings, restart services, and view log information. You can change many of these settings also via the system administration and the probe settings tab in the PRTG web interface.
Note: To get familiar with the different components of PRTG, we recommend you to read the Architecture section.
Note: All settings made here are only valid for the local installation running on the computer you open the program on. In order to change settings for another installation, for example, another remote probe installation, please log in to this computer and open the program there.
Note: This section describes the available settings in the PRTG Administration Tool when you open the tool on a PRTG remote probe system. If you open this program on the PRTG core server, you have also access to settings regarding your whole PRTG installation.
From the PRTG Network Monitor group in Windows start menu, please select PRTG Administration Tool to open the application. You can choose from these options in different tabs:
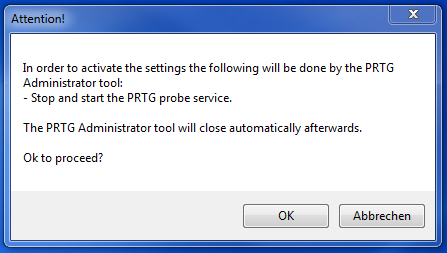
When you close the program with the Ok button after changing settings, you are asked to restart the probe service in order to save the settings. Please confirm by clicking the OK button. Otherwise the changes are ignored.

PRTG Administrator: Restart Probe Service
Probe Settings for Core Connection
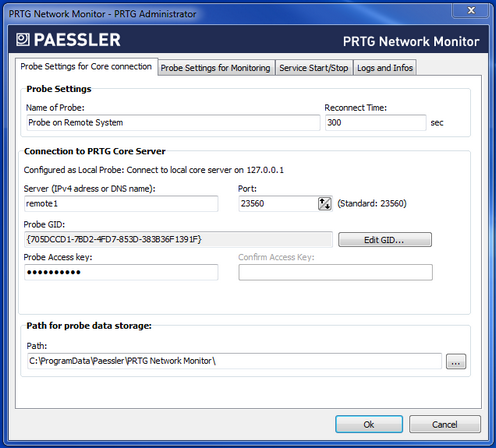
Define general settings regarding the probe and probe connections.

PRTG Administrator: Probe Settings for Core Connection
Probe Settings |
|
|---|---|
Name of Probe |
Enter a meaningful name to identify the probe. PRTG shows this name, for example, in the device tree, and in all alarms by default. Please enter a string. |
Reconnect Time |
Define the time that PRTG will wait until the probe tries to reconnect to the core server if the connection fails. Please enter an integer value. |
Connection to PRTG Core Server |
|
|---|---|
These settings will affect how the probe will connect to the core server. A probe is either a local probe or a remote probe. PRTG will automatically detect the type of probe and show the correct setting options. |
|
Server (IPv4 address or DNS name) |
If this probe is configured as the Local Probe of the PRTG core installation, it will connect to the core via 127.0.0.1 which you cannot change. If this probe is configured as a Remote Probe, enter the IP address or DNS name of the core server. |
Port |
Define the Port number under which probe and core server will communicate. Please enter an integer value. We recommend using the default value. |
Probe GID |
The Probe GID is a unique identifier for the probe. We recommend you to not change it. Exception: Only if you substitute an existing probe from a different computer, you have to copy the GID from the old probe to the new probe. To do so, click on the Edit GID... button and confirm the warning with Yes. You can then change the value. Note: You can deny GIDs under System Administration—Core & Probes in the PRTG web interface. |
Probe Access Key |
You do not need an access key for Local Probe connections. On a Remote Probe, the Probe Access Key must match one of the access keys configured in your PRTG core server installation. If it does not match, the remote probe will not be able to connect to the core server. Please see System Administration—Core & Probes section for more information. Note: Also check allowed and denied IPs there to ensure that the core server accepts the IP address of the remote probe. |
Confirm Access Key |
If you enter an access key for a remote probe, enter it in this field again to assure correctness. |
Path for Probe Data Storage |
|
|---|---|
Path |
Define the data folder to which PRTG will store configuration and monitoring data. Click on the ... button to choose another folder on your system. Note: Before changing the path, make sure you stop both services and copy all data to the new location. |
Administrative Probe Settings / Probe Settings for Monitoring |
|
|---|---|
Define the IP address used for outgoing monitoring requests.
Note: If you change this setting, some sensors might stop working. For example, sensors might show a Down status if the selected IP address is blocked on the way to or directly on the monitored device. |
|
Outgoing IPv4 |
Define the IP address for outgoing requests using the IPv4 protocol. The list shows all IP addresses available on the current system. Choose a specific IP address or select auto. |
Outgoing IPv6 |
Define the IP address for outgoing requests using the IPv6 protocol. The list shows all IP addresses available on the current system. Choose a specific IP address or select auto. For details about the basic concept of IPv6 in PRTG, please see IPv6 section. |
You can stop and start PRTG Windows service manually. Click the Stop Core Server resp. Stop Probe Service button to stop a service, and Start Core Server resp. Start Probe Service to start it again. Both actions usually take from a few seconds up to several minutes to complete. You can also restart the core server and probes via the PRTG web interface under Administrative Tools.
Note: If you want to schedule an automatic restart of Windows services for both core server and probe service, define a schedule on the Settings tab of a probe, section Administrative Probe Settings, in the PRTG web interface.
Log Files |
|
|---|---|
Open Log Folder... |
Open the PRTG Network Monitor data directory on your hard disk drive to access all log files which PRTG creates. |
Send Logs to Paessler... |
Open an assistant to send log files to the Paessler support team. Please see below for details. Note: You can send log files more easily with the support bundle via Contact Support in the PRTG web interface. |
Open Support Ticket... |
This will open the support form on Paessler's webpage in a browser window. Note: If you need help, we recommend you to use the Contact Support option in the PRTG web interface instead. |
The About section shows information about the version of installed PRTG programs and copyright.
Note: You can send log files more easily with the support bundle via Contact Support in the PRTG web interface.

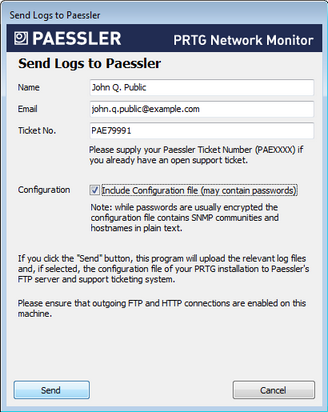
Send Logs to Paessler
If you open a support ticket, Paessler support might ask you to send log files for further analysis. With the Send Logs to Paessler... button, PRTG will automatically collect, compress, and send your log files.
Send Logs to Paessler |
|
|---|---|
Name |
Enter your name. |
Enter your valid email address. You can provide any of your addresses; however, recommended and default is the email address of your PRTG account. |
|
Ticket No. |
This field is optional. If you have already opened a ticket at Paessler support, please provide the ticket number you received. Your files will then be associated with your ticket automatically. Please enter the ticket number starting with PAE followed by four or more digits, for example, PAE12345. If you do not have a ticket number, leave this field empty. |
Configuration |
Define if your configuration file will be included in the data. PRTG will remove all passwords from the config file before sending it to our support team. |
Click on the Send button to start data upload. Ensure that FTP and HTTP connections are allowed on this machine.
Related Topics |
|---|
Keywords: Automatic,Automatic Restart Options (Probe System),Configure,Configure Probe,Configure Reboot (automatic),Probe Administrator,Restart Options (Probe System),Scheduled Reboot (Probe System)